Learn how to measure and analyze phase error in PLLs using oscilloscopes.
Article by John Ong | 19 Sep 2025
Learn how to measure and analyze phase error in PLLs using oscilloscopes. This step-by-step guide explains cycle-by-cycle phase analysis, acquisition length importance, and practical examples for debugging PLL circuits.
What is Phase Error in PLLs?
A Phase-Locked Loop (PLL) is a control system that synchronizes the output signal with a reference signal. As clock speeds increase, the margin for phase error tightens. Measuring and analyzing this phase error helps engineers optimize PLL stability and performance.

How to Measure Phase Difference with an Oscilloscope
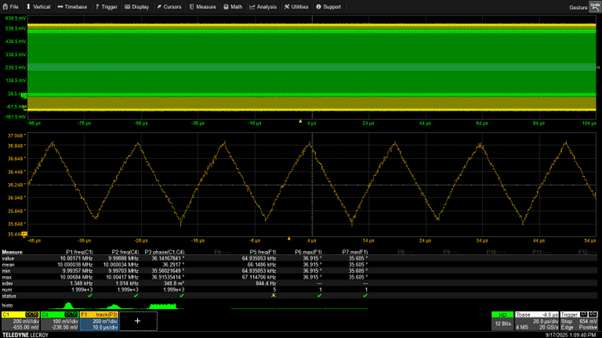
The reference input FIN and feedback FF waveforms are captured, displayed, and measured as shown in Figures 2 and 3.
- Amplitude of FIN channel 1 = 1.29 V
- Amplitude of FF channel 4 = 0.48 V
- Frequency of both signals = 10.0 MHz (with phase delay between them)
- Phase difference between FIN and FF = 36.3° (≈ 10 ns in time)

Cycle-by-Cycle Phase Analysis in PLLs
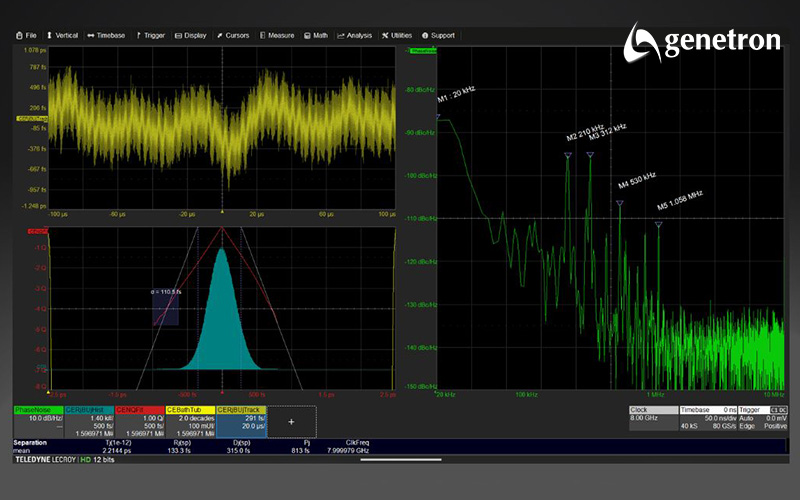
Statistical accumulation of more than 24,000 measurements shows that the phase between C1 and C4 ranges from 35.6° to 36.9°, a variation of 1.3°. Oscilloscopes can reveal these variations by plotting phase differences cycle by cycle. This enables engineers to see both repeated patterns and transient events.
Phase changes occur over longer timescales than waveforms themselves. For example, in Figure 3, the waveform period is 100 ns (10 MHz) while the C1–C4 phase changes occur at 15.34 µs (65 kHz). This requires oscilloscopes with deep acquisition memory.
Why Acquisition Length Matters in Phase Measurements
Long acquisitions become more important when PLL circuits use dynamic closed-loop control. Designers need to observe changing phase patterns to tune control parameters like kP and kI coefficients. Oscilloscopes with large acquisition memory are critical for this task.
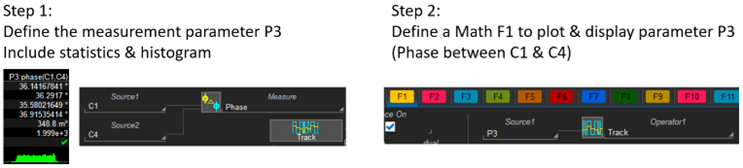
Figure 5 demonstrates a 5 ms acquisition revealing two distinct patterns of phase difference changes. These patterns differ in both frequency and magnitude. Note that this acquisition length is 25× longer than Figure 3 (5 ms vs. 200 µs).

Conclusion: Why Long Acquisitions Are Essential for PLL Debugging
PLL tuning requires capturing long acquisitions of input waveforms and observing phase differences over extended timescales. Depending on the phase pattern, acquisitions may need to cover up to 100,000 cycles to reveal repeatability. Oscilloscopes capable of cycle-by-cycle timing analysis are therefore essential for accurate PLL debugging.
References
Tags:
PLL measurement,
Phase error analysis,
Oscilloscope techniques,
Timing jitter & phase noise,
Control loop debugging,
Signal integrity,
Electronic test & measurement,
High-speed clocks